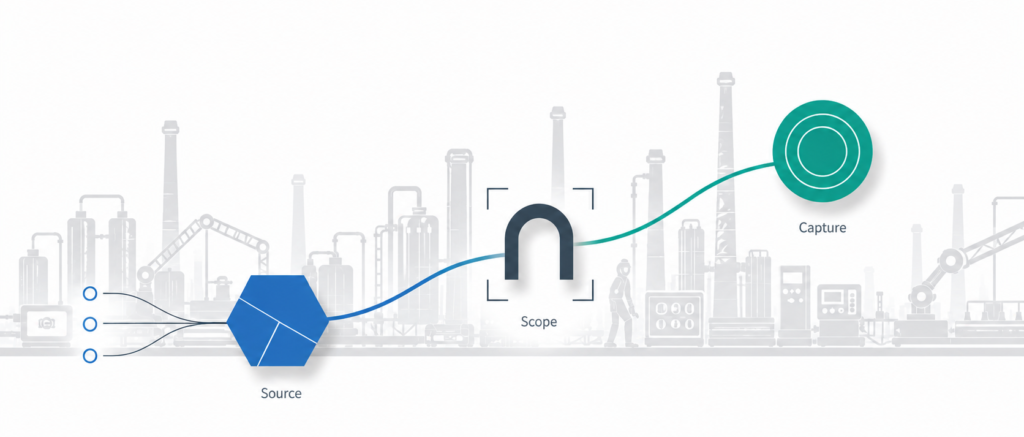
Most manufacturers treat “grow service revenue” as a single problem. It is rather three separate questions, usually collapsed into one strategy slide: what revenue this organization can actually generate from its installed base, does the organization’s structure even allow it to access that revenue, and once access is established, how does that revenue actually get captured.
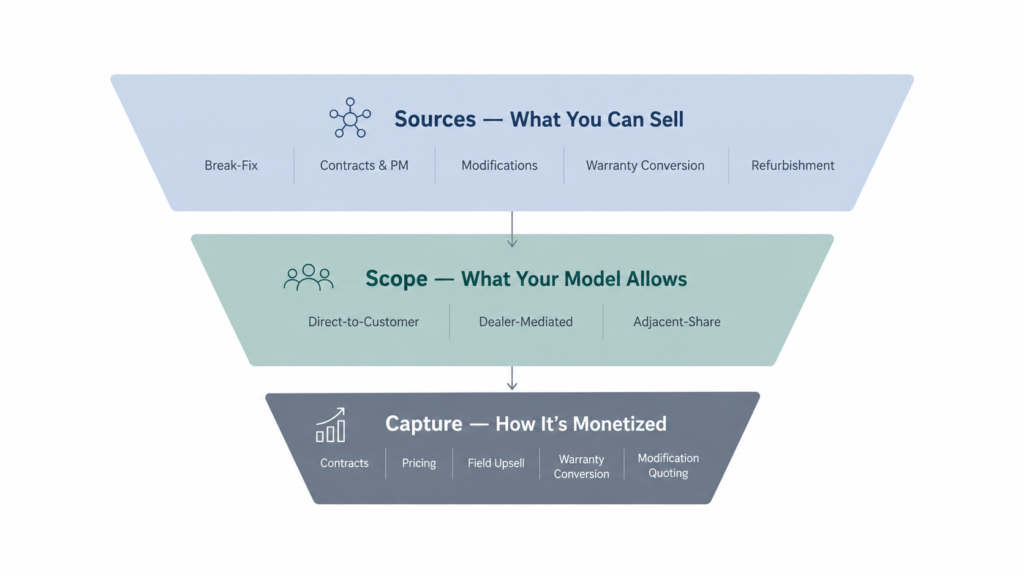
Service revenue growth in manufacturing depends on three layers working together: revenue sources (what can be sold), strategic scope (what your business model actually lets you access), and capture mechanisms (how it’s monetized once access exists). Capturing the full value of diverse revenue streams requires a business model built to reach and activate them. And even the right scope produces nothing without the discipline to capture what it makes available. This page maps all three.
Layer One: Revenue Sources – Where Service Revenue Comes From
Before anything gets captured, priced, or contracted, there has to be a real service line generating revenue in the first place. Most manufacturers can name two or three without thinking; the rest tend to be underused, misclassified, or missed entirely.
| Source | What It Is |
|---|---|
| Break-Fix / Reactive Service | Unscheduled repair work billed when equipment fails |
| Preventive Maintenance & Contracted Service | Scheduled, recurring service work sold under a coverage agreement |
| Modifications, Upgrades & Retrofits | Lifecycle project work like control upgrades, retrofits, capacity changes, scoped and sold like a small capital project |
| Warranty-to-Contract Conversion | The revenue created when a customer converts from expiring warranty coverage into a paid service agreement |
| Refurbishment, Trade-In & Circular Revenue | Revenue from restoring, reselling, or trading in equipment at end of lifecycle |
| Software, Subscription & Training Revenue | Emerging lines tied to connected asset software, usage-based subscriptions, and certification/training programs |
Break-Fix and Reactive Service
The oldest and still most universal source: something fails, a technician fixes it, the customer pays. It’s rarely strategic, but it’s real revenue, and for many manufacturers, especially those without a mature contract base, it remains the largest single line item in service revenue, even if nobody talks about it that way.
Preventive Maintenance and Contracted Service
Scheduled service work, whether time-based or usage-based, converts unpredictable break-fix revenue into recurring, plannable revenue. This is usually where “service revenue strategy” conversations start and usually where they stop, treating contracted PM as the whole of installed base monetization rather than one source among several.
Modifications, Upgrades, and Retrofits
This is lifecycle services: a control system upgrade, a safety retrofit, a capacity modification on an asset already in the field. It’s frequently misclassified as a “field upsell”. This work is closer to a small capital project than a service call, and it needs its own scoping and sales motion to be captured well.
Warranty-to-Contract Conversion
The moment warranty coverage ends is a genuine revenue-source moment, not just a governance checkpoint. It’s the highest-intent point in the entire customer lifecycle to sell a service contract because the customer is already thinking about coverage, whether or not anyone shows up with an offer. The mechanics of why this conversion gets missed so often are covered in depth in the execution piece; here, it’s worth naming simply as a source that most organizations already have and routinely under-monetize. For the cost-avoidance side of warranty such as leakage, goodwill, exceptions see Warranty Management in Manufacturing.
Refurbishment, Trade-In, and Circular Revenue
As equipment ages, refurbishment and trade-in programs create a revenue line that’s also, increasingly, a sustainability story. Lifecycle-driven service work reduces waste and emissions while creating a new sale from an asset that’s already been through one lifecycle, see Sustainability & Aftersales for the fuller case.
Emerging Sources: Software, Subscription, and Training
For manufacturers with mature, connected fleets, software and subscription revenue on top of the physical asset is becoming a real line item, not a future concept. Training and certification revenue is smaller but real for complex-equipment OEMs, particularly where dealer or customer technicians need certified competency to service equipment under warranty.
Connected assets aren’t a revenue source by themselves but they’re what makes several of these sources possible. Telemetry doesn’t generate revenue directly; it enables usage-based contracts, shifts the mix from reactive to proactive service, and feeds the installed base visibility that every other source depends on.
The mechanics of turning that machine data into actual revenue are covered in IT-OT Integration in Aftersales: Turning Machine Data into Service Revenue.
Layer Two: Strategic Scope – What Determines Your Service Revenue Strategy
This layer matters as much as Layer One, and its job is to take everything named in the sources layer and filter it down to what’s actually accessible for a given organization. That access isn’t universal and it depends entirely on how the business is structured: whether it sells direct or through a channel, whether it owns the end-customer relationship, and what data it actually has visibility into.
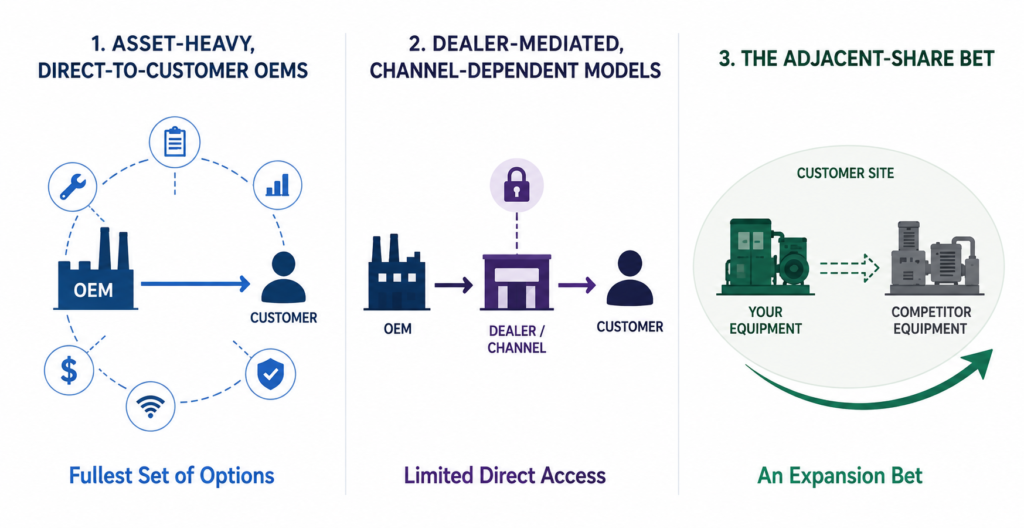
Asset-Heavy, Direct-to-Customer OEMs
Manufacturers who ship complex equipment and maintain a direct relationship with the end customer have the fullest set of options: installed base visibility, direct contract attach, connected asset data, and direct warranty-to-contract conversion are all reachable, assuming the organization builds the capture discipline to use them.
Dealer-Mediated and Channel-Dependent Models
Automotive is the clearest example, but it’s far from the only one: when a dealer network sits between the OEM and the end customer, the OEM frequently doesn’t own the end-user relationship or the usage data that installed base monetization depends on. Several of the capture mechanisms described in Layer Three simply aren’t directly reachable. The OEM can’t run its own contract-attach motion on a customer it doesn’t have a direct relationship with. Revenue has to route through different instruments instead: parts sell-through economics, warranty administration efficiency, and dealer incentive design become the primary options, not substitutes for the “real” ones.
This is a significant enough topic on its own, how dealer-mediated OEMs should think about service revenue differently from direct-to-customer ones, that it deserves its own dedicated treatment. For a fuller look at how Dealer/ Channel dynamic is shifting, see The Dealer’s Changing Role in OEM Aftersales: Partner, Channel, or Liability?
The Adjacent-Share Bet
A different strategic question entirely: rather than asking “how do I extract more value from my own installed base,” some organizations ask “is there a larger share of the customer’s total site available to me, including equipment I didn’t sell.” This is an expansion bet, not a monetization-of-what-you-have bet.
Service teams are usually sitting on the best intelligence for exactly this question, and most organizations never use it. A technician on-site for a routine PM visit sees the competitor equipment in the same facility, its condition, its approximate age, and often the customer’s frustration with how it’s being serviced. This information is not captured in any CRM system, and no sales rep is positioned to observe this. That intelligence routinely goes nowhere, because nobody has defined whose job it is to act on it.
This raises a genuinely unresolved question: is capturing that adjacent share a service function’s job, or a sales function’s job? Most organizations haven’t answered this cleanly, and the ambiguity itself is often the reason the opportunity goes uncaptured even when the intelligence exists.
Layer Three: Capture Mechanisms – How Installed Base Monetization Actually Happens
Having a source and the scope to reach it doesn’t guarantee the revenue is captured. This is the layer where most manufacturers already have activity. The contracts get sold, parts get priced, technicians occasionally flag opportunities, but where the mechanics break at predictable handoffs between functions with conflicting incentives.
| Mechanism | What It Captures |
|---|---|
| Contracts | Recurring revenue from preventive maintenance and coverage agreements |
| Parts Pricing | Margin on the parts required to deliver break-fix and PM work |
| Field Upsell | Commercial leads technicians identify during routine visits |
| Warranty-to-Contract Conversion | The handoff moment when coverage lapses into a paid agreement |
| Modification & Upgrade Quoting | Lifecycle project work scoped and sold on its own track |
Each mechanism carries a different weight depending on where an organization’s revenue actually concentrates. Service Contracts typically matter most because they convert unpredictable revenue into forecastable revenue, the single biggest lever for planning and valuation, not just cash flow. Parts pricing has the fastest impact on margin, since it touches nearly every transaction rather than a subset of accounts. Field upsell and modification quoting are usually smaller individually but compound over the life of an asset, particularly on long-lived industrial equipment. Warranty-to-contract conversion is unique in that it’s a one-time window per asset. Miss it, and the opportunity doesn’t recur until the next equipment cycle.
Each mechanism breaks in a different place. Contracts break at the ownership seam between sales and service. Parts pricing breaks where local flexibility meets centralized margin accountability. Field upsell breaks on incentive design. Warranty conversion breaks on a missing trigger. Modification quoting breaks because it’s routed like a repair instead of a project.
The detail on each, and what actually fixes it, is covered in Service Revenue Execution: Where the Five Levers Actually Break.
Why All Three Layers Have to Move Together
A wide set of revenue sources means nothing if your business model’s scope can’t reach most of them, for example, a dealer-mediated OEM can identify installed-base opportunities in detail and still have no way to act on a single one of them. A well-executed capture mechanism aimed at scope that was never actually available pulls on a lever that isn’t there. And the right scope with no source depth behind it is access to a market with nothing to sell into it.
Margin is usually where the gap between these layers shows up first and most visibly. But the root cause is almost never one bad number. It’s a mismatch between what an organization can source, what its structure actually lets it reach, and how well it captures what’s reachable.
This is the same disconnect explored in why your Service KPIs are improving but Revenue isn’t. Operational metrics move in the right direction while the layer beneath them stays broken.
A Self-Assessment: Where Is Your Organization Actually Stuck?
Before reaching for a strategy refresh, it is worth locating which layer is genuinely weak, since the fix for each looks nothing like the others.
- Source depth: Can you name every revenue line currently active in your service organization, including the ones nobody tracks separately, like modifications or refurbishment? If break-fix and PM are the only two lines anyone can name, the gap is here.
- Structural reach: Does your organization actually have access to the data, the customer relationship, and the decision rights needed to reach the sources your strategy assumes? If your model runs through dealers or channel partners, this is very often where the real constraint sits, before execution ever enters the picture.
- Capture discipline: Of the sources you can actually reach, how many convert reliably into revenue from contract renewals, warranty-to-contract handoffs to field-identified leads? If the mechanisms exist on paper but underperform in practice, the gap is execution, not strategy, see the levers breakdown for the specific fix.
For a fuller structured walkthrough across people, process, and performance, the Service-Led Growth Readiness Checklist is a useful next step once you’ve located the layer.
Where to Start
Don’t try to fix all three layers at once. Identify the weakest one, the one where you genuinely can’t answer the self-assessment question cleanly and start there. A source problem needs new revenue lines named and scoped. A scope problem needs an honest look at what your business model actually permits, which may mean the strategy itself needs to change, not just its execution.
Ready to see where you stand?
Download the free Service-Led Growth Checklist to assess your organization’s readiness and identify the next best moves toward a lifecycle-driven business model.